Chapter 2: AI Tools in Data Mining and Analytics
Course Outcome
VCCS-2. Data Analytics and Insights: Analyze how AI-driven data analytics tools process large datasets to identify business patterns, trends, and opportunities.
Artificial Intelligence tools are being used in data mining and analytics in 2026. They are not usually replacing the whole analytics department with a single chatbot. A more accurate picture is this: businesses are adding AI features into the tools they already use for data storage, dashboards, reporting, forecasting, customer analysis, fraud detection, inventory planning, and decision support.
Data mining means finding useful patterns in data, especially patterns that are too large or messy for a person to spot by hand. Analytics means turning data into useful answers for decisions. A college might analyze enrollment trends. A retailer might analyze which products sell together. A bank might analyze transactions to detect fraud. A hospital might analyze appointment patterns to reduce no-shows.
AI is now being used across that pipeline. It helps people clean data, search large datasets, summarize documents, build charts, detect unusual behavior, predict future outcomes, and ask questions in plain English instead of writing database code. The important point is that AI is not magic. It still depends on good data, clear business questions, security rules, and human judgment.
Recent government data gives us a useful reality check. The U.S. Census Bureau added supplemental AI questions to its Business Trends and Outlook Survey from November 2025 through February 2026 to measure how businesses are using AI, including by industry, geography, firm size, task, and impact on work. (Census.gov) A 2026 Census working paper using that survey found that during November 2025 through January 2026, about 18% of firms used AI in at least one business function, rising to 32% when weighted by employment, meaning workers are more likely to be employed at firms that use AI than the firm-count number alone suggests. Adoption was much higher in very large firms and in information, professional services, and finance. (Census.gov)
That means AI analytics is real, but uneven. Many large companies are already using it. Many small organizations are experimenting. Plenty of businesses still use ordinary spreadsheets, dashboards, and manual reports.
Core concepts: AI, machine learning, analytics, and business intelligence
Artificial intelligence, or AI, is software that performs tasks we usually associate with human reasoning, such as recognizing patterns, classifying information, generating text, or making recommendations. Machine learning, or ML, is a major type of AI in which a system learns patterns from examples instead of being programmed with every rule manually. For example, a fraud detection model may learn from thousands or millions of past transactions labeled “fraud” or “not fraud.”

Generative AI is AI that creates new content, such as text, code, images, summaries, or answers. A large language model, or LLM, is a generative AI model trained to work with language. ChatGPT, Claude, Gemini, and many enterprise assistants are examples of LLM-based systems. In analytics, LLMs are often used as an interface: a manager types, “Which region had the biggest decline in repeat customers?” and the system translates that question into a database query, chart, or written explanation.
Business intelligence, often shortened to BI, refers to software and processes for reporting and dashboards. Power BI, Tableau, Looker, and similar tools help organizations visualize data. A dashboard is a screen of charts and metrics, such as daily sales, inventory levels, or customer satisfaction scores. A data warehouse is a central database designed for analysis. A data lake stores large amounts of raw or semi-structured data. A semantic model is a business-friendly layer that defines what terms mean, such as “net revenue,” “active customer,” or “return rate,” so that analytics tools answer questions consistently.
Modern AI analytics usually combines these pieces: databases, dashboards, machine learning models, natural-language chat, data governance, and human review.
How AI is being used in data mining and analytics

1. Natural-language analytics: “talking to your data”
One of the most visible changes is natural-language analytics. Instead of writing SQL, which stands for Structured Query Language and is the standard language for asking questions of databases, a user can type a normal question.
For example:
“Show me total profit by product category for the last three months, and highlight anything unusual.”
The AI system may generate a chart, a table, or a written summary. Microsoft says Copilot in Power BI lets users interact with data using natural language, create and analyze visuals, ask ad hoc questions, and summarize reports, while also warning that the data model must be prepared properly or answers can become generic, inaccurate, or misleading. (Microsoft Learn) Microsoft also documents Copilot’s ability to create and edit Power BI report pages from natural-language prompts. (Microsoft Learn)
Google’s BigQuery analytics platform now includes Gemini features that let users use natural language to discover, transform, query, and visualize data. (Google Cloud Documentation) Snowflake’s Cortex Analyst is described as an LLM-powered feature that lets business users ask questions in natural language and receive answers from structured data in Snowflake without writing SQL. (Snowflake Documentation) Tableau Agent, from Salesforce, similarly helps users explore data, create visualizations, and uncover insights through a conversational assistant connected to a workbook or data source. (Tableau Help)
The business value is not just convenience. Natural-language analytics can let nontechnical employees ask follow-up questions without waiting days for an analyst. The risk is that people may trust a fluent answer too quickly. A good analytics team still checks whether the AI used the right table, the right definition, and the right time period.
2. Data preparation and cleaning
Before data can be analyzed, it usually has to be cleaned. Data cleaning means fixing or handling missing values, duplicate records, inconsistent labels, impossible dates, and other quality problems. A simple example: one sales table might say “NY,” another says “New York,” and another says “N.Y.” A person or system has to decide whether these mean the same thing.
AI tools are increasingly used to suggest data transformations. They can detect possible duplicates, standardize categories, recommend joins between tables, and explain confusing fields. Google’s BigQuery release notes reported a 2025 feature allowing users to prepare data with Gemini using natural language. (Google Cloud Documentation) Tableau Agent also advertises natural-language data preparation, including cleaning, shaping, calculations, and pivoting tables. (Tableau)
This is useful because many analytics projects spend more time preparing data than analyzing it. But there is a catch: AI may make a confident-looking cleaning suggestion that changes the meaning of the data. For example, combining “returned item” and “refunded order” might be wrong if the company tracks those differently. In real organizations, data preparation should be reviewed by someone who understands the business.
3. Text and document mining
Traditional analytics worked best with structured data: rows and columns, like a spreadsheet. But many business records are unstructured data, meaning they do not fit neatly into rows and columns. Examples include customer emails, chat transcripts, PDFs, repair notes, contracts, call-center logs, product reviews, and medical notes.
AI is very useful for mining this kind of text. It can classify support tickets, extract names or dates from documents, summarize customer complaints, detect sentiment, and group similar comments. Snowflake’s AI SQL functions include tasks such as extracting entities, aggregating insights across customer tickets, sentiment analysis, document parsing, and preparing data for retrieval-augmented generation. (Snowflake Documentation) Retrieval-augmented generation, or RAG, is a method where an AI model answers a question using retrieved company documents or database records, rather than relying only on what the model learned during training.
JPMorgan Chase provides a concrete example from a large financial institution. In its 2025 annual report, the company described AI capabilities tying together research, data, and risk across about 90,000 securities and 22 million documents, plus tools that ingest thousands of broker research reports daily and push prioritized insights to investors. These are company-reported claims, not independent academic measurements, but they show how a major bank describes actual AI analytics use in production.
4. Predictive analytics and forecasting
Predictive analytics means using past data to estimate what may happen next. A model might predict next month’s sales, which customers are likely to cancel a subscription, which invoices may be paid late, or which machines may fail soon.
AI forecasting is not new. Businesses have used statistical forecasting for decades. What has changed is that AI tools are becoming easier to use and more embedded in cloud platforms. Google’s BigQuery AI documentation says users can train, evaluate, and deploy predictive analytics models directly within BigQuery using SQL, and can use generative AI functions for summarization, sentiment analysis, and enrichment. (Google Cloud)
JPMorgan Chase reported more than ten years of advanced machine learning and AI work, with company-described value across credit, fraud, and personalization. Its 2025 annual report also says its commercial and investment bank uses AI in transaction screening, cash-flow forecasting for treasury clients, securities inventory management, pricing, risk management, and capital optimization. These examples show AI analytics moving beyond “make me a chart” into operational decision support.
5. Anomaly detection and fraud detection
An anomaly is something unusual compared with normal patterns. Anomaly detection is used in cybersecurity, banking, manufacturing, retail, and logistics. A credit card purchase in a new country may be normal for a traveler but suspicious for someone who never leaves town. A sudden spike in product returns may indicate a defective batch or fraud. A server producing unusual login attempts may signal a cyberattack.
Machine learning is useful here because fraud patterns change. Rule-based systems, such as “block every transaction over $1,000,” are too simple. AI systems can look at combinations of signals: location, amount, device, time of day, purchase history, merchant type, and recent behavior.
The practical deployment pattern is usually human-in-the-loop. Human-in-the-loop means the AI flags or ranks cases, but a person reviews important decisions. This matters because false positives can annoy customers or delay legitimate transactions, while false negatives can miss real fraud.
6. Customer segmentation, personalization, and recommendations
Segmentation means grouping customers or products based on shared characteristics. A retailer might identify “budget shoppers,” “high-frequency snack buyers,” or “seasonal gift buyers.” A streaming service might group viewers by viewing patterns. A college might group students by support needs, such as first-generation students who may benefit from early advising.
AI can discover patterns that are hard to spot manually. It can recommend products, personalize offers, rank sales leads, or suggest next-best actions for customer service. Salesforce’s 2025 Form 10-K says its platform connects customer data across systems to create a complete view of customers, and its analytics offerings, including Tableau, help users visualize, analyze, spot trends, predict outcomes, receive recommendations, and take action with AI agents. (SEC)
This kind of analytics can be helpful, but it can also become invasive or unfair if organizations use sensitive personal data carelessly. Personalization should not become manipulation, discrimination, or surveillance.
7. AI agents connected to business data
An AI agent is software that can use tools, follow instructions, and take steps toward a goal. In analytics, an agent might answer a question, run a query, create a chart, summarize results, and send a draft report. In more advanced settings, an agent may trigger a workflow, such as opening a support ticket or recommending a reorder quantity.
Snowflake’s 2025 Form 10-K says Snowflake Intelligence enables customers to create data agents so business users can take actions on structured and unstructured data without technical knowledge or coding skills. (SEC) Palantir’s 2024 Form 10-K says its Artificial Intelligence Platform, or AIP, connects large language models and other AI with customer data and operations to support decision-making within legal, ethical, and security constraints. It also describes workflows involving data engineers, analysts, data scientists, business users, and senior leaders. (SEC)
This is where analytics starts to blend with operations. The system is not only answering “What happened?” It is helping decide “What should we do next?”
What deployment looks like inside a real organization
A typical business AI analytics setup has several layers.
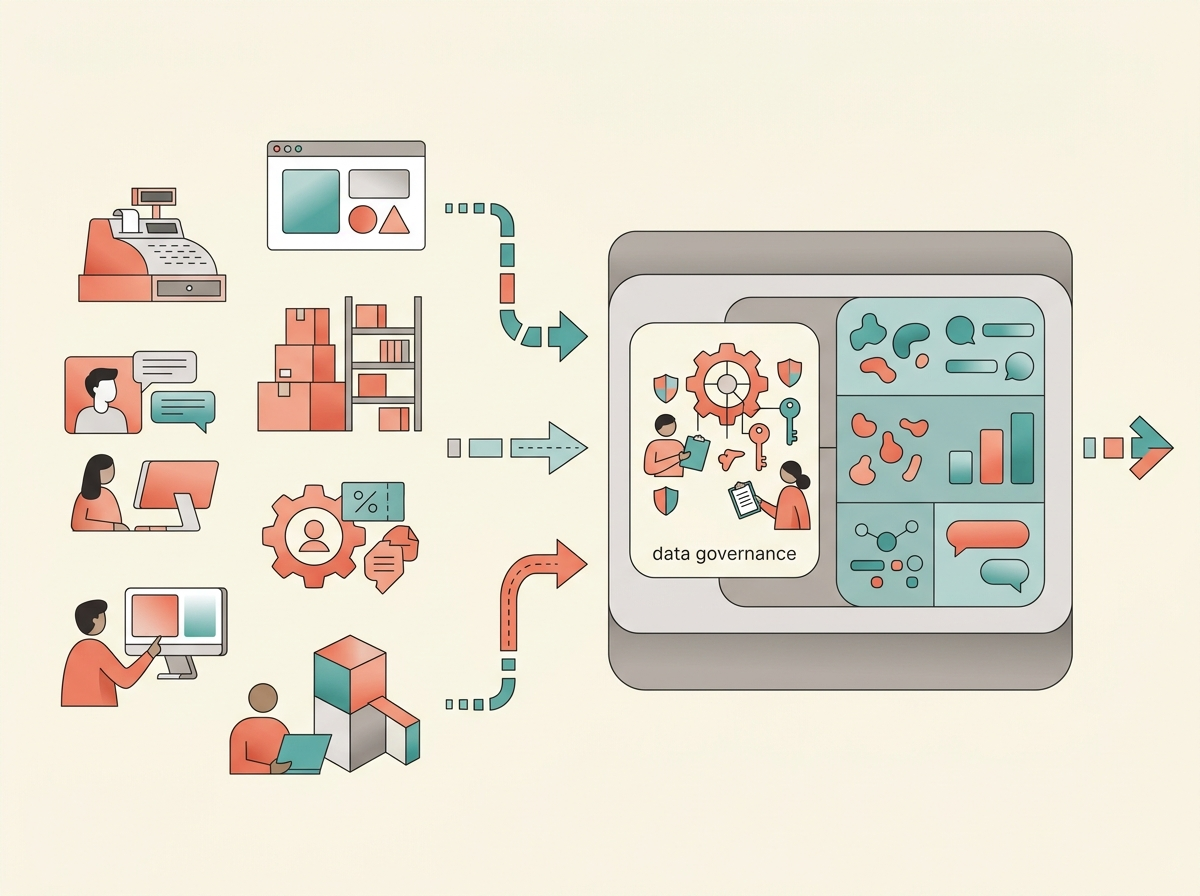
First, data is collected from business systems: sales systems, websites, inventory systems, customer relationship management systems, accounting software, support tickets, sensors, or external market data. Second, the data is moved into a warehouse, lake, or platform where it can be governed. Data governance means rules for who can access data, what definitions mean, how quality is checked, and how data is protected. Third, analytics tools create reports, dashboards, models, and alerts. Fourth, AI features help users ask questions, summarize results, detect patterns, and recommend actions.
This is why companies selling analytics platforms now describe themselves as AI data platforms. Alphabet’s 2025 10-K says Google Cloud’s data and analytics offerings help customers migrate, clean, prepare, and feed data into models, while unifying data lakes, warehouses, governance, and machine learning so users can analyze data using AI models across clouds. (SEC) Snowflake says its platform helps customers consolidate data into a single source of truth, drive insights, apply AI to business problems, build data applications, and handle structured, semi-structured, and unstructured data. (SEC)
On the user-company side, Walmart’s 2025 Form 10-K says it continues to invest in AI and generative AI to enhance customer shopping and associate work experiences and improve efficiencies in supply chain, operations, management functions, and talent recruitment and development. Walmart also warns that these technologies bring operational, legal, privacy, compliance, and reputation risks. (Walmart Inc.) That is a realistic disclosure: AI is useful, but it creates new responsibilities.
What AI does well — and what it does poorly
AI analytics is strong at pattern recognition, summarization, classification, prediction, and interface design. It can speed up routine tasks and make data tools more accessible.
But there are major limits.
Garbage in, garbage out means bad input data leads to bad output. If a company’s customer records are outdated, duplicated, or biased, AI may produce polished but wrong conclusions. Hallucination means a generative AI system produces an answer that sounds confident but is false or unsupported. In analytics, hallucination is especially dangerous because a false number in a business report can lead to a bad decision.
Bias means a system produces unfair results for certain groups, often because the training data reflects past discrimination or incomplete measurement. Model drift means a model becomes less accurate over time because the world changes. For example, a demand forecast trained on last year’s shopping patterns may fail after a competitor opens nearby or prices change.
Regulators and standards bodies are paying attention. NIST’s Generative AI Profile, released in 2024, is designed to help organizations identify generative AI risks and choose risk-management actions. (nist.gov) The European Union’s AI Act entered into force in 2024 and becomes broadly applicable in stages, with full applicability generally beginning in August 2026, though some provisions apply earlier. (Digital Strategy EU) The U.S. Federal Trade Commission has also warned that companies may face consequences for using consumer data unlawfully, including deletion of products, models, or algorithms built from unlawfully obtained data. (Federal Trade Commission)
The practical lesson is simple: analytics AI should be checked, logged, secured, and governed.
Hands-on lab: Use AI to mine a small sales dataset
Lab goal
You will use an AI assistant and a spreadsheet to analyze a small dataset. The goal is not to let AI do everything. The goal is to learn how to ask better questions, verify answers, and turn data into a short business recommendation.
You may use Excel, Google Sheets, LibreOffice Calc, or another spreadsheet tool. You may use any AI assistant your class allows.
Scenario
You are helping a small campus store analyze product sales. The manager wants to know which products are profitable, which have high return rates, and what actions to take next month.
Copy this CSV data into a spreadsheet:
month,channel,category,product,units_sold,revenue,cost,returns,discount_pct
2026-01,Store,Beverages,Cold Brew,520,2080,780,12,0.05
2026-01,Online,Beverages,Cold Brew,180,756,270,7,0.10
2026-01,Store,Snacks,Protein Bar,430,1075,516,9,0.00
2026-01,Online,Snacks,Protein Bar,210,546,252,13,0.05
2026-01,Store,Supplies,Notebook,260,1040,572,5,0.00
2026-01,Online,Supplies,Notebook,160,704,352,11,0.15
2026-02,Store,Beverages,Cold Brew,610,2440,915,14,0.05
2026-02,Online,Beverages,Cold Brew,240,1008,360,8,0.10
2026-02,Store,Snacks,Protein Bar,390,975,468,10,0.00
2026-02,Online,Snacks,Protein Bar,260,676,312,19,0.05
2026-02,Store,Supplies,Notebook,300,1200,660,6,0.00
2026-02,Online,Supplies,Notebook,190,836,418,16,0.15
2026-03,Store,Beverages,Cold Brew,700,2800,1050,18,0.05
2026-03,Online,Beverages,Cold Brew,310,1302,465,10,0.10
2026-03,Store,Snacks,Protein Bar,420,1050,504,8,0.00
2026-03,Online,Snacks,Protein Bar,300,780,360,24,0.05
2026-03,Store,Supplies,Notebook,340,1360,748,7,0.00
2026-03,Online,Supplies,Notebook,230,1012,506,21,0.15
Step 1: Create calculated fields
Add these columns:
profit = revenue - cost
profit_margin = profit / revenue
return_rate = returns / units_sold
net_units = units_sold - returns
Use spreadsheet formulas. Format profit_margin and return_rate as percentages.
Step 2: Ask AI for a data profile
Paste the dataset into your AI assistant and use this prompt:
You are helping me analyze a small campus store dataset.
First, profile the data. Identify the columns, explain what each one means, and suggest three business questions this dataset can answer.
Do not make conclusions yet.
Check whether the AI correctly understands the dataset. If it invents columns or makes claims that are not in the data, note that as an error.
Step 3: Ask AI for analysis, but require evidence
Use this prompt:
Using only the data I provided, answer these questions:
1. Which product-category combination produced the most total profit?
2. Which channel has the higher average return rate?
3. Which product seems most concerning from a returns perspective?
Show the calculations or explain exactly how you reached each answer.
Now verify the answer in your spreadsheet using a pivot table or manual sorting. This is the key skill: do not just accept the AI’s answer because it sounds professional.
Step 4: Ask for a business recommendation
Use this prompt:
Write a short business recommendation for the campus store manager.
Include:
- one action to increase profit,
- one action to reduce returns,
- one warning about the limits of this dataset.
Keep it under 180 words and avoid unsupported claims.
A strong answer should mention that the dataset is small, synthetic, and only covers three months. It should avoid pretending to know customer demographics, weather, supplier problems, or long-term demand.
Step 5: Write your lab memo
Submit a one-page memo with four parts:
Pattern found: What did the data show?
AI help: What did the AI assistant do well?
AI risk: What did the AI get wrong, skip, or overstate?
Decision: What would you recommend to the manager?
This lab mirrors real AI analytics work. The AI can speed up exploration, but the analyst remains responsible for checking the logic.
Key takeaways
AI tools are definitely being used in data mining and analytics. The strongest evidence is not futuristic advertising; it is visible in government adoption surveys, public company filings, and product documentation from major data platforms.
The most common uses are natural-language data questions, automated reporting, data cleaning, text mining, forecasting, anomaly detection, recommendations, and AI agents connected to business data. The pattern across tools is similar: AI is becoming part of the analytics workflow rather than a separate “robot analyst.”
The realistic picture is mixed. AI can reduce friction and help more people use data. It can also produce wrong answers faster, hide bias behind polished language, or expose sensitive information if governance is weak. Good organizations treat AI analytics as a powerful assistant inside a controlled data process, not as an unquestionable decision-maker.