Chapter 7: AI Tools in Financial Forecasting and Budgeting
Course Outcome
VCCS-7. Financial Forecasting and Budgeting Using AI: Apply AI-driven financial forecasting and budgeting techniques to predict trends, manage risks, and optimize business financial strategies.
AI tools are definitely being used in financial forecasting and budgeting in 2026. They are not usually “robot CFOs” making final budget decisions on their own. In most organizations, they are assistive tools built into spreadsheets, accounting software, enterprise planning platforms, business intelligence dashboards, and enterprise resource planning systems.
The best current evidence shows a mixed picture: adoption is real, but uneven. The Association for Financial Professionals reported in its 2025 FP&A Benchmarking Survey that 23% of finance planning and analysis professionals were using AI tools on a daily, weekly, or monthly basis, while another 40% were testing AI and planned to implement it within the next year. The same survey found that spreadsheets are still everywhere: 96% of respondents used spreadsheets for planning, and 93% used them for reporting at least daily or weekly. It also found that unreliable and inaccessible data were major barriers. (AFP)
Another 2025 FP&A Trends survey found a more cautious picture: only 8% of surveyed FP&A teams were actively using machine learning or predictive analytics in forecasting, while 18% were using generative AI in some capacity. Among the generative AI users, most were using it for communication and decision support; only a smaller share used it directly for forecasting or scenario modeling.
So the answer is: yes, AI is being used in financial forecasting and budgeting, but mostly as a co-pilot, not an autopilot. It helps analysts clean data, identify patterns, generate baseline forecasts, explain variances, test scenarios, and draft reports. Humans still approve budgets, challenge assumptions, decide tradeoffs, and take responsibility for the numbers.
1. What financial forecasting and budgeting mean
Before we talk about AI, we need to define the finance work.
Financial forecasting means estimating what will happen in the future: next month’s sales, next quarter’s cash flow, next year’s payroll expense, or how much inventory the company will need. A forecast is not a promise. It is an informed estimate based on current data, historical patterns, and assumptions about the future.
Budgeting means deciding how much money the organization plans to spend and earn over a future period. A budget is usually more formal than a forecast. It can set targets for departments, managers, hiring, marketing, equipment purchases, debt repayment, and profit.
FP&A, short for financial planning and analysis, is the business function that prepares forecasts, budgets, performance reports, and “what if?” analyses for management. FP&A teams help leaders answer questions such as:
“How much cash will we have in 13 weeks?”
“What happens if sales are 5% lower than expected?”
“Can we afford to hire 20 more people?”
“Why did actual expenses come in higher than budget?”
For decades, this work has relied heavily on spreadsheets. Spreadsheets are flexible and familiar, but they also create problems. Different departments may use different versions of a file. Manual copy-and-paste work can introduce errors. Analysts can spend more time collecting and checking numbers than actually thinking about the business.
That is where AI tools are starting to matter.
2. The main types of AI being used
The phrase artificial intelligence, or AI, refers to computer systems that perform tasks that normally require human-like judgment, pattern recognition, language processing, or prediction. In finance, the most relevant forms are machine learning, predictive analytics, and generative AI.
Machine learning, or ML, is a type of AI that learns patterns from examples. In forecasting, a machine learning model might study past sales, prices, holidays, weather, website traffic, and customer behavior, then estimate future sales.
Predictive analytics means using data to estimate what is likely to happen next. Not all predictive analytics is advanced AI. Some forecasting tools use older statistical techniques, such as moving averages or exponential smoothing, which are mathematical methods for smoothing out noisy historical data. These are still useful and often more trustworthy than more complex models.
Generative AI is AI that creates new text, code, images, summaries, or explanations from prompts. A prompt is the instruction a user types or speaks to an AI tool. In finance, generative AI is commonly used to summarize results, draft budget narratives, answer questions about a report, or explain why actual results differed from forecast.
A fourth category is automation, which means software completing repeated tasks with less manual effort. Automation is not always AI. For example, automatically copying sales data from an accounting system into a planning model may be automation, even if no machine learning is involved. In real business systems, automation and AI are often combined.
3. Where AI fits in the forecasting and budgeting workflow
A typical financial forecasting and budgeting process has several stages. AI tools can assist at almost every stage.

Stage 1: Collecting and preparing data
A finance team may need data from an ERP system, short for enterprise resource planning system. An ERP is the main software system many organizations use to manage accounting, purchasing, inventory, payroll, invoices, and financial records. The team may also need data from a CRM system, short for customer relationship management system, which tracks sales opportunities and customer activity. Other data might come from payroll systems, bank accounts, point-of-sale systems, websites, inventory platforms, and spreadsheets.
This first stage is often the hardest. AI does not magically fix messy data. If product names are inconsistent, customer records are duplicated, sales regions are coded differently across systems, or managers use different spreadsheet formats, the model will struggle.
This is not a minor issue. The AFP survey found that many FP&A professionals face problems with data reliability, data accessibility, legacy systems, and disconnected tools. (AFP) FP&A Trends also reported that many teams are still working with older systems, and that spreadsheet-heavy teams spend a large share of their time on data collection and validation rather than insight and action.
AI tools can help by identifying missing values, detecting unusual entries, suggesting data transformations, matching similar categories, or converting messy tables into cleaner formats. Microsoft, for example, says its Finance capabilities in Microsoft 365 Copilot can connect to systems of record such as Dynamics 365 Finance or SAP and help users analyze forecast variances, spot anomalies, and prepare finance workflows inside familiar tools such as Excel and Outlook. (Microsoft) Microsoft also says Copilot in Excel can use Python-backed analysis for tasks such as forecasting and risk analysis from natural-language instructions. (Microsoft Support)
The important point: AI forecasting starts with data plumbing. Clean data is not glamorous, but it is the foundation.
Stage 2: Creating a baseline forecast
A baseline forecast is the model’s first estimate of what will happen if current trends continue. For example, it might estimate next quarter’s revenue based on last year’s revenue, recent growth, seasonality, and known sales patterns.
Seasonality means a regular pattern that repeats at certain times. A retailer may sell more in December. A landscaping company may earn more in spring and summer. A college bookstore may see spikes at the beginning of each semester.
Forecasting tools can use many methods. Some are simple, such as:
A moving average, which averages recent periods to smooth out ups and downs.
Exponential smoothing, which gives more weight to recent data than older data.
ARIMA, a statistical forecasting method often used for time-series data, meaning data recorded over regular time intervals.
More advanced tools may use machine learning models that consider many variables at once. For example, revenue may depend on sales pipeline, price changes, customer churn, advertising spend, hiring levels, subscription renewals, weather, commodity prices, or macroeconomic conditions.
Oracle’s Enterprise Performance Management tools include predictive planning features that use historical data to create forecasts, compare predictions with existing plans, and produce prediction ranges such as best-case and worst-case outcomes. Oracle’s documentation describes forecasting methods such as moving averages, exponential smoothing, and ARIMA, and explains that the software can compare methods using error measures. (Oracle Docs) Oracle’s Intelligent Performance Management features also look for forecast variance, forecast bias, anomalies, trends, and correlations in planning data. (Oracle Docs)
Anaplan’s PlanIQ is another example. Anaplan says PlanIQ combines statistical forecasting, AI, and machine learning to generate predictions from internal and external data, compare model performance, and integrate forecasts into planning workflows. (Anaplan Inc)
Stage 3: Connecting forecasts to business drivers
A business driver is a factor that directly affects financial results. For a software company, drivers might include number of subscribers, renewal rate, average subscription price, and cloud hosting cost. For a restaurant, drivers might include customer traffic, average ticket size, food cost, labor hours, and rent. For a hospital, drivers might include patient volume, staffing ratios, reimbursement rates, and supply costs.
AI becomes more useful when it connects numbers to drivers. A forecast that says “revenue will be $12 million” is less helpful than one that says, “Revenue is likely to be $12 million because renewal rates improved, new bookings increased, and churn declined.”
Workday describes AI features in Workday Adaptive Planning that support variance analysis, predictive forecasting, what-if scenarios, and conversational questions against financial plans. Workday says its tools can help users identify forecast drivers, compare scenarios, and track forecast confidence. (Workday)
This is especially important in budgeting. A budget is not just a prediction. It is a choice. Leaders may ask: Should we spend more on marketing? Should we delay hiring? Should we raise prices? AI can estimate possible outcomes, but managers must decide which tradeoffs fit the organization’s goals and risks.
Stage 4: Scenario planning
Scenario planning means building multiple versions of the future. Instead of asking for one answer, the team asks:
“What if revenue grows 10%?”
“What if revenue falls 5%?”
“What if wages rise?”
“What if a major customer leaves?”
“What if we open a new location?”
AI tools can make scenario planning faster by adjusting many related assumptions at once. For example, if sales increase, the model may also increase inventory purchases, payment processing fees, warehouse labor, sales commissions, and taxes. If hiring is delayed, the model may reduce payroll costs but also reduce expected production capacity or customer service levels.
This is one of the most useful real-world applications because businesses rarely need a single perfect forecast. They need a range of possible outcomes and a plan for responding.
Coca-Cola HBC, a large bottling partner in the Coca-Cola system, describes using machine learning algorithms in demand forecasting and planning tools that support scenario planning, production sequencing, and medium- to long-term planning. This is not just finance department budgeting; it is operational planning that feeds financial budgets through expected demand, production needs, and inventory decisions. (CCH Group Website)
Stage 5: Variance analysis
Variance analysis means comparing actual results with the budget or forecast and explaining the difference. A variance is simply a difference between expected and actual results.
Suppose a department budgeted $100,000 for travel but spent $130,000. The variance is $30,000 unfavorable because the department spent more than planned. The next question is why. Was there a major conference? Higher airfare? More customer visits? Poor approval controls? A one-time event?
AI tools can scan transactions and highlight unusual changes. They can identify departments, vendors, products, regions, or accounts that changed more than expected. They can also draft explanations for finance teams to review.
Microsoft’s Finance capabilities in Copilot include variance analysis features that identify anomalies and shifts, explain drivers, and draft management reporting narratives. (Microsoft) NetSuite Planning and Budgeting also describes AI and machine learning features that analyze multiple business drivers, surface insights, detect anomalies, and generate commentary explaining financial changes. (NetSuite)
This does not remove the analyst. It changes the analyst’s work. Instead of spending hours finding the biggest variances, the analyst can spend more time asking whether the explanation makes business sense.
Stage 6: Narrative reporting
Finance teams do not only produce numbers. They also produce explanations for managers, boards, banks, investors, grant funders, and department heads.
Generative AI is useful here because it can turn a table into a readable first draft. For example:
“Revenue was 4% above forecast due to higher renewal rates in the Northeast region. Payroll expense was 3% above budget because of overtime in customer support. Management should watch support staffing levels in the next quarter.”
Business intelligence tools are adding this type of capability. In Power BI, Microsoft describes Copilot-supported narrative visuals that create text summaries of report pages or visuals, while also warning users to review summaries for accuracy and understand that summaries depend on the data shown in the report. (Microsoft Learn)
That warning matters. A generative AI summary can sound confident even when it is incomplete or wrong. A good finance workflow treats AI-written narratives as drafts that must be checked against the numbers.
4. Examples from large, mid-sized, and small organizations
AI forecasting and budgeting looks different depending on the size of the organization.
Large enterprises
Large companies often use dedicated EPM systems, short for enterprise performance management systems. EPM software supports planning, budgeting, forecasting, consolidation, reporting, and performance management across departments and business units.
A large company may have thousands of cost centers, multiple currencies, international tax issues, complex supply chains, and strict access controls. In that setting, AI forecasting is usually embedded in a governed platform, not a random chatbot.
A current example comes from Arm Holdings, the semiconductor design company. MIT Sloan reported in 2026 that Arm’s finance team had moved from forecasting royalties with Excel and other tools to using AI to build forecasts. Arm’s CFO explained that royalty forecasting is important because a large share of Arm’s revenue comes from royalties paid on billions of chips per quarter. (MIT Sloan)
This example is useful because it shows AI being used where the finance problem is data-heavy and recurring. The company still needs finance judgment, but AI can help process patterns at a scale that would be difficult in manual spreadsheets.
Mid-sized companies
Mid-sized companies often use platforms such as NetSuite, Workday Adaptive Planning, Anaplan, OneStream, Planful, Pigment, or similar planning tools. They may not have huge data science teams, but they still need better forecasting than manual spreadsheet rollups.
Workday has published a customer story about Team Car Care, the largest Jiffy Lube franchisee, moving from dozens of spreadsheets to a centralized planning platform and using Workday AI-related features for forecasting and planning. Because this is vendor-published, it should be read as a customer testimonial rather than independent proof of ROI, but it does show the type of deployment companies are buying: replacing spreadsheet-heavy planning with a centralized platform that includes predictive tools. (Workday)
Anaplan has also published customer material describing how The Coca-Cola Company uses Anaplan to work with bottling partners on revenue growth management planning. Again, because this is vendor-published, it should be treated as evidence of product use and customer positioning, not neutral measurement of financial impact. (Anaplan Inc)
Small businesses
Small businesses usually do not start with enterprise AI platforms. They start with accounting software, bank feeds, spreadsheets, and maybe a payroll or point-of-sale system.
For a small business, the most important forecast may be cash flow, which means the timing of money coming in and going out. A company can be profitable on paper but still run short of cash if customers pay late, inventory must be purchased early, or payroll comes due before revenue is collected.
Intuit’s QuickBooks documentation describes AI-assisted cash flow forecasts in Intuit Enterprise Suite that use roughly 18 months to two years of past financial data to generate a 13-week forecast, with monthly views up to 12 months. (QuickBooks) Xero’s cash flow tools also show how small-business forecasting often uses invoices, bills, expected payment dates, recurring transactions, and user-created scenarios, even when the tool is not necessarily presented as advanced AI. (Xero)
For small businesses, the practical value is not “AI strategy.” It is answering questions such as:
“Can I make payroll next month?”
“Can I buy new equipment?”
“What happens if my largest customer pays two weeks late?”
“Do I need a line of credit before the slow season?”
5. What AI is good at in finance planning
AI tools are strongest when the task has clear data, repeated patterns, and a need for speed.
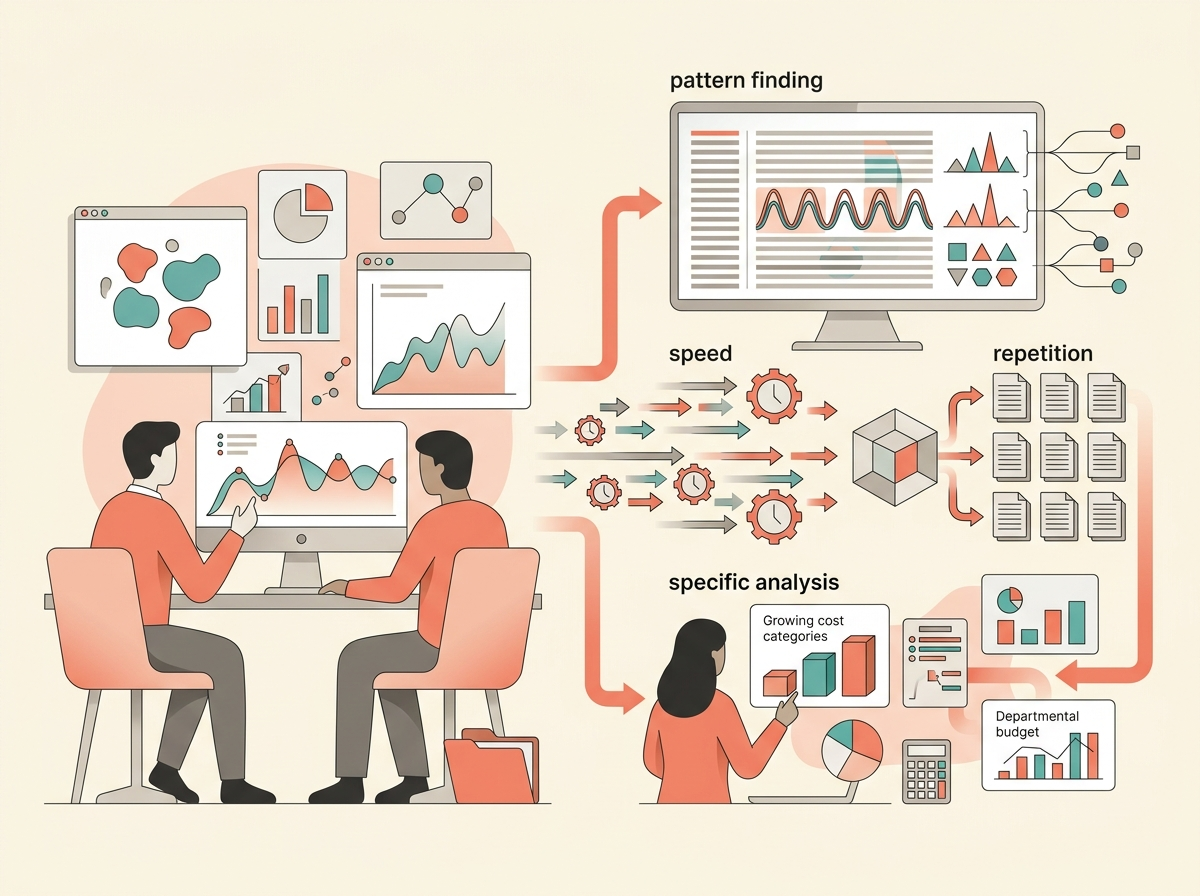
They are good at finding patterns across many rows of historical data. They can spot recurring seasonality, unusual spikes, delayed payments, expense categories that are growing quickly, or departments that consistently over-budget or under-budget.
They are good at producing a first forecast quickly. A finance analyst can then compare that forecast with management’s judgment, sales pipeline information, and known business events.
They are good at scenario modeling. Instead of rebuilding a spreadsheet manually, an analyst can ask the system to test a lower-sales case, a higher-cost case, or a delayed-hiring case.
They are good at summarizing. A tool can draft a plain-English explanation of budget variances, highlight the biggest changes, or prepare a first version of a management report.
They are also useful for democratizing access to finance data. Democratizing access means making data easier for non-specialists to use. A department manager may not know how to build a pivot table or write a database query, but they can ask, “Why is my travel budget over plan?” A governed AI assistant can help them find the answer without waiting for an analyst to manually prepare a custom report.
6. What AI is not good at
AI forecasting is not magic. It has several serious limits.
First, AI depends on data quality. If the historical data is incomplete, mislabeled, biased, duplicated, or outdated, the forecast may be wrong. MIT Sloan’s 2026 discussion of AI in finance emphasized that finance teams need clean data and that analytics projects often require substantial work just to acquire and clean the data. (MIT Sloan)
Second, prediction is not the same as judgment. A model might predict that sales will grow next quarter, but it cannot automatically know whether the company should hire more staff, raise prices, borrow money, or enter a new market. Those are business decisions involving risk, ethics, strategy, and human consequences.
Third, forecasting is not the same as causation. Causation means one thing actually causes another thing to happen. A model may find that marketing spend and revenue move together, but that does not prove that spending more on marketing will cause revenue to rise. Research on machine learning for FP&A has emphasized that prediction tools are useful, but planning and resource allocation often require causal reasoning, not just pattern recognition. (Springer)
Fourth, generative AI can make mistakes. A large language model, or LLM, is a generative AI system trained to predict and produce text. LLMs are powerful writing and summarizing tools, but they are probabilistic, meaning they generate likely answers rather than guaranteed correct answers. MIT Sloan quoted finance leaders warning that LLMs should be treated as a first draft or assistant, not the final answer in finance. (MIT Sloan)
Fifth, models can drift. Model drift happens when the real world changes and the old data no longer predicts the future well. A restaurant’s 2023 sales pattern might not work after a new competitor opens nearby. A retailer’s pandemic-era e-commerce pattern might not match later customer behavior. A company’s cost model may break when interest rates, wages, exchange rates, or supply chain costs change.
Sixth, security and access control matter. Financial forecasts may include payroll plans, layoffs, acquisition discussions, pricing strategy, cash problems, or investor-sensitive information. AI tools used in finance need permissions, audit trails, role-based access, and data governance. Microsoft and Workday both emphasize governed access and enterprise security in their finance AI offerings. (Microsoft)
7. How the finance job changes
AI does not remove the need for finance professionals. It changes what good finance work looks like.
A traditional junior analyst might spend much of the week downloading data, fixing spreadsheet formats, updating formulas, checking totals, and preparing slides. With AI-enabled tools, some of that work can be automated or accelerated.
But the analyst still needs to ask better questions:
“Is this forecast based on the right driver?”
“Did the model overreact to one unusual month?”
“Does the forecast match what the sales team is seeing?”
“Are we confusing correlation with causation?”
“Would this budget decision hurt customer service or employee retention?”
“Can managers understand and trust this explanation?”
The future finance professional needs both technical fluency and business judgment. Technical fluency does not mean every finance worker must become a data scientist. It means they should understand enough about data, models, prompts, controls, and limitations to use AI responsibly.
Hands-on Lab: Build and Check an AI-Assisted Cash Forecast
Lab goal
In this lab, you will act as a junior FP&A analyst for a small café. Your job is to create a simple three-month cash forecast, then use an AI assistant as a reviewer—not as the final authority.
You can complete this lab in Excel, Google Sheets, or another spreadsheet tool. You may also use a generative AI tool if your instructor allows it.
Dataset
Copy this table into a spreadsheet.
| Month | Revenue | Payroll | Rent & Utilities | Inventory Purchases | Other Expenses |
|---|---|---|---|---|---|
| Jan 2025 | 42,500 | 15,500 | 6,200 | 12,200 | 4,100 |
| Feb 2025 | 43,800 | 15,500 | 6,200 | 12,400 | 4,200 |
| Mar 2025 | 46,000 | 15,800 | 6,200 | 13,100 | 4,000 |
| Apr 2025 | 48,500 | 16,000 | 6,300 | 13,900 | 4,300 |
| May 2025 | 51,200 | 16,200 | 6,300 | 14,700 | 4,500 |
| Jun 2025 | 54,000 | 16,500 | 6,300 | 15,400 | 4,800 |
| Jul 2025 | 57,500 | 16,800 | 6,400 | 16,200 | 5,100 |
| Aug 2025 | 56,900 | 16,800 | 6,400 | 16,000 | 5,000 |
| Sep 2025 | 52,300 | 16,600 | 6,400 | 14,900 | 4,700 |
| Oct 2025 | 49,700 | 16,400 | 6,500 | 14,100 | 4,500 |
| Nov 2025 | 50,800 | 16,600 | 6,500 | 14,300 | 4,600 |
| Dec 2025 | 59,000 | 17,200 | 6,600 | 16,900 | 5,300 |
| Jan 2026 | 47,400 | 17,300 | 6,700 | 13,300 | 4,300 |
| Feb 2026 | 48,900 | 17,300 | 6,700 | 13,700 | 4,400 |
| Mar 2026 | 51,600 | 17,600 | 6,700 | 14,600 | 4,400 |
| Apr 2026 | 53,900 | 17,800 | 6,800 | 15,200 | 4,500 |
| May 2026 | 56,200 | 18,000 | 6,800 | 15,900 | 4,700 |
| Jun 2026 | 58,000 | 18,100 | 6,800 | 16,300 | 4,900 |
Step 1: Calculate net cash flow
Add a new column called Net Cash Flow.
Use this formula:
Revenue - Payroll - Rent & Utilities - Inventory Purchases - Other Expenses
For June 2026, the calculation is:
58,000 - 18,100 - 6,800 - 16,300 - 4,900 = 11,900
That means the café generated an estimated positive cash flow of $11,900 in June 2026.
Step 2: Create a simple baseline revenue forecast
Use a three-month moving average for July 2026 revenue.
Average April, May, and June 2026 revenue:
(53,900 + 56,200 + 58,000) ÷ 3 = 56,033
So a simple baseline forecast for July 2026 revenue is $56,033.
This is intentionally simple. It does not fully account for seasonality, but it gives you a starting point.
Step 3: Add a seasonal adjustment
Now look at summer 2025. Revenue rose from June 2025 to July 2025:
57,500 - 54,000 = 3,500
That was an increase of about 6.5%.
Apply a cautious seasonal adjustment to June 2026 revenue:
58,000 × 1.065 = 61,770
Now you have two possible July revenue estimates:
Simple moving average: $56,033
Seasonally adjusted estimate: $61,770
This shows an important forecasting lesson: the method matters. Different reasonable methods can produce different results.
Step 4: Build three scenarios
Create three July 2026 scenarios.
| Scenario | Revenue Assumption |
|---|---|
| Low case | $56,033 |
| Base case | $61,770 |
| High case | $64,859 |
The high case is 5% above the base case:
61,770 × 1.05 = 64,859
Now estimate expenses. Use these assumptions:
Payroll: $18,300 Rent & utilities: $6,900 Inventory purchases: 28% of revenue Other expenses: $5,000
For the base case, inventory would be:
61,770 × 0.28 = 17,296
Base-case net cash flow would be:
61,770 - 18,300 - 6,900 - 17,296 - 5,000 = 14,274
Step 5: Use an AI assistant carefully
Paste the data and your formulas into an AI tool and use this prompt:
You are helping an FP&A analyst review a small café cash forecast. Use only the data provided. Create a July 2026 low, base, and high cash-flow forecast. State your assumptions clearly. Do not invent new data. Show the arithmetic. Flag any risks or missing information.
Now compare the AI output with your spreadsheet. Do not assume the AI is correct.
Check these items:
Did it use only the data you provided?
Did it calculate inventory correctly as 28% of revenue?
Did it subtract all expense categories?
Did it label assumptions clearly?
Did it make up facts, such as customer counts or menu prices?
Did it explain uncertainty?
This is how AI should be used in finance: as a reviewer, accelerator, and idea generator—not as an unchecked authority.
Step 6: Write a short finance comment
Write a three-sentence management comment:
“The July base-case forecast shows positive cash flow of about $14,274, mainly because revenue is expected to improve during the summer season. The largest risk is that the seasonal increase may not repeat, which would bring cash flow closer to the low case. Management should monitor weekly sales and inventory purchases before committing to major new spending.”
That comment is simple, but it does what finance communication should do: it connects the numbers to the business decision.
Key takeaway
AI tools are already being used in financial forecasting and budgeting, but the most common real-world pattern is human-led, AI-assisted planning. AI helps finance teams prepare data, create baseline forecasts, test scenarios, spot variances, and draft explanations. The strongest organizations do not simply “trust the AI.” They combine AI outputs with clean data, business knowledge, internal controls, and human judgment.